

May Results for Zip Code 77441
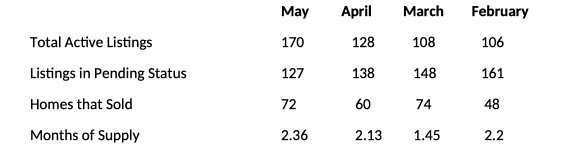
 As mentioned in the above video, the market changed dramatically since last month. As indicated below, Active inventory rose over 32%. Welcomed news for Buyers, yet also an indication for Sellers on why they may need to adjust to the new market conditions. Listings in Pending Status declined over the last 3-months, which also shows a continuing downward trend in the market. The good news is that the number of homes Sold increased. However, “Months of Supply” increased slightly. This stat is a good one to watch because it provides one of the best insights into the direction of the market.
May Results by Community
Weston Lakes:
 The number of Active homes on the market rose to total (10). That’s actually good news since this is still reasonable. However, the Days on Market is increasing significantly, with the majority passing (30) days. May also ended with (10) homes in Pending Status, yet that was down from (14) in April. Impressively, the (10) homes that Sold did so at an average of $870,256 and just under $200 per square foot. So, a mixed month, yet very rewarding to see that prices are holding relatively steady.
![]()
 Fulbrook:
Well, good news that there are (2) homes on the market. Yet, both are “exceptional”, with one testing the market at over $400 per square foot. So, we’ll see how well the market reacts to both. There is (1) home in Pending, and there is a reason why it went under contract in just (5) days. It was priced below $1 million and had some exceptional features that most any Buyer would want. There were also (2) homes that Sold. Both at $825,000 and both at around $250 per square foot. The one on Tree Farm Lane though, set a record for the highest price for this David Weekley section. The moral is, price a home to the market, and it will sell.
![]()
Fulbrook on Fulshear Creek:
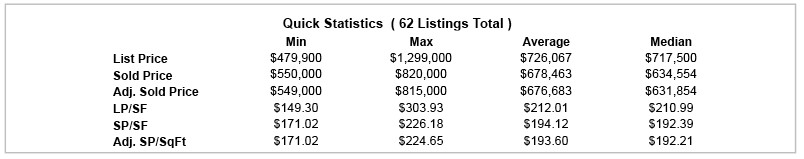
 If you’re a Buyer looking for homes, this is the place! There are now (31) homes on the market. This is up substantially from the (23) in April. That’s a whopping 34% increase. This would normally be a concern, however, as evidenced by May ending with (21) homes in Pending Status, it appears demand is keeping up with supply. Most are all new homes though.
![]()
 Cross Creek Ranch:
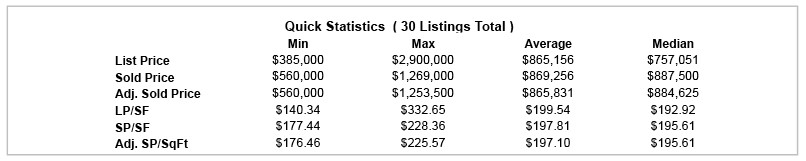
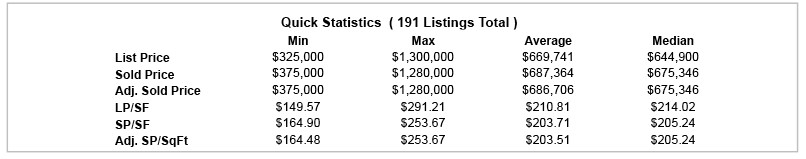
The Active inventory has been increasing in “size” and it rose dramatically from (63) in April to (92) in May. This is mostly due to the New Home Builders though, trying to catch up to demand. Hopefully, they didn’t “overshoot” by providing too much supply. Regardless, it’s good news for Buyers that finally have more choices. Although, prices will be higher. That’s because nothing is reducing building costs and this should be a stabilizing factor more so in Fulshear, since the market is driven by New Homes. There are (59) Listings in Pending Status, and again, these are mostly new homes. That’s good news for the Resales because most of the New Homes are under construction and could be months before most are completed. Most rewarding is that (40) homes sold and they averaged $687,364 and $203 per square foot. This was about the same as April. So, no market correction on Price.
![]()
Fulshear Run:
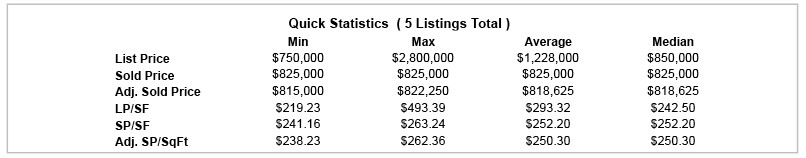
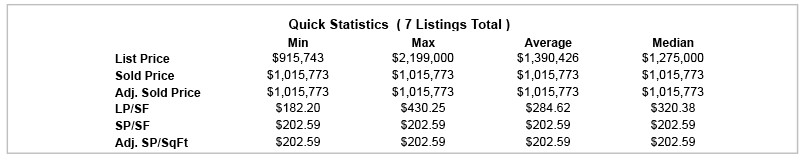
 This community continues to post impressive results. Especially, for one that is mostly comprised of “million dollar” homes. May’s results were rewarding with (4) Available homes on the market. Prices range from around $1 million to nearly $2 million. There were also (2) Listings in Pending Status. How exclusive is it here? The one in Pending is Listed at $2 million and at $430 per square foot. Amazing! Almost as impressive, is the Tri Pointe home that Sold for just over $1 million and at $202 per square foot.
![]()
 Polo Ranch:
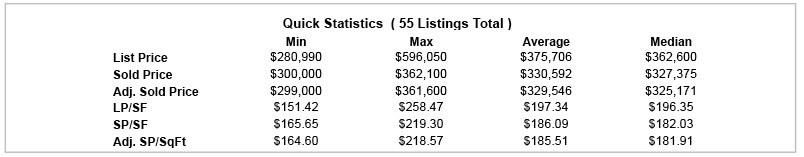
The number of available homes on the market, increased again in May to total (24). And, there were just about as many homes in Pending with the month ending with (23). It’s always a mystery though, as to where are all the Sold homes are. Although, there were (8) in May, I can’t seem to figure out why every month there is always more in Pending that never seem to make their way to Sold Status. Not sure why? However, the ones reported did average $330,592 and at $186 per square foot.
![]()