July Housing Report
This is a very unique time in history, especially for our local housing market. With rapidly rising prices, could this be a repeat of the “Crash” of 2008?
Watch the video below to find out.

What About Appraisals?
When we represent a Seller, the appraisal is always a concern for us. And conversely, when representing a Buyer, we want to ensure that their Purchase Price is a true reflection of the current market. However, it is even more of a concern in this extraordinary market with rapidly rising Prices; and usually with an insufficient number of comp’s to support the Purchase Price. As such, I thought a brief insight into appraisals would be apropos.
To prevent what happened in 2008, Appraisers now have to follow much stricter guidelines. So, how do they substantiate the higher Sales Prices and get homes to appraise in this market? An Appraiser explained to me, that in addition to other “adjustments”, in an appreciating market they are also able to factor in a “time line” to determine market value. For instance, if the Appraiser can show that in preceding months, similar homes were increasing in value by 5%, then they can add this factor to the home they are appraising. So, if a similar home Sold for $500,000 2-months ago, and another 1-month ago for $525,000 they could appraise the new subject property for $551,000. This is one means to handle rising prices.
July Results for Zip Code 77441
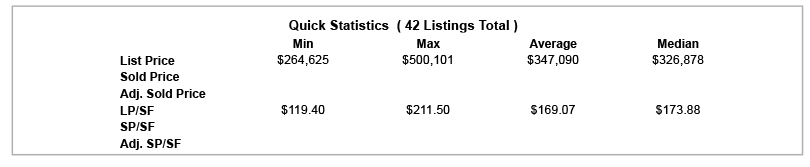
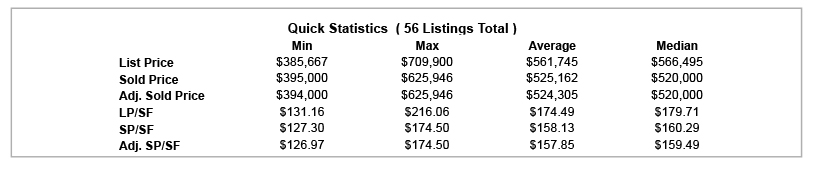
The average LIST PRICE in Zip Code 77441 in July was a mind boggling $698,544, with an average Price Per Square Foot (PPSF) of $179. Yet, the average SALES PRICE was only $567,423 and just $159 PPSF. Does this disparity between Actives and Sold’s cause a concern? Are these new List Prices too high? Are Buyers paying too much? Yet, as the below indicates, the market has stability, is somewhat balanced and there certainly is not an oversupply of Listings. No worries….today.
July Results by Community
Weston Lakes:
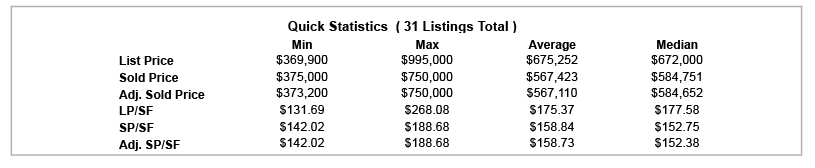
 Active inventory is remaining relatively steady and ended July with a total of (9). Surprisingly, there was an increase, albeit just (1). Impressively, there are (14) homes in Pending Status and (8) that Sold. What is interesting though, are the numbers behind these figures. Average Price for the Actives was $698,544 with an average Price Per Square Foot (PPSF) of $179.54. However, those that Sold did so at an Average Sales Price of $567,423 and with a PPSF of $158.84. Numbers can be made to tell any story, yet it shows, that at least in July, the market is still appreciating. And, that is good news for those Sellers that are contemplating selling their home. Call us if you are, our Buyers need you!

 Fulbrook:
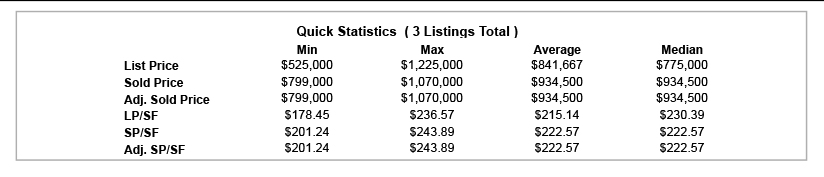
In June there was (1) Active Listing. Today, that Listing is now under contract. The last time there were NO Active homes for Sale in Fulbrook? It was a very long time ago! Now, just a distant memory to a time when Sellers were frustrated with their beautiful homes sitting on the market for extended periods of time. Now, it’s the Buyers turn to wait for a New Listing to enter the market. Amazing turnaround! There were also (2) homes that Sold, and both did so at over $200 per square foot.

 Fulbrook on Fulshear Creek:
It was good news for a moment where Active inventory bucked the trend and actually rose in June. The trend didn’t last long though, as it dropped in July to (23) homes that are now Available for Buyers. More insightful? Only (2) were Resales. This shows that Buyers are not very patient in wanting to wait for a home to be built. There was also very rewarding results with (24) Listings in Pending Status, of which (7) were Resales. Lastly, (7) homes Sold and more than half (4) were Resales. Again, more evidence that Buyers want a home NOW.

Cross Creek Ranch:
Just as in June, Active inventory in July is keeping pace with Buying activity, and rewardingly, increased by (2) to a total of (64). The homes in Pending Status also increased significantly to (53). This is up about 10% from June. More impressive? The homes that Sold increased to (59), which was a 21% increase. Taking all the results together, it indicates the semblance of a balanced market with demand equaling supply.

Polo Ranch:
The results for Polo Ranch have always been like a yo-yo; where results vary wildly from month-to-month. July was no different, and was witness to Active inventory increasing from just (7) in June to a new total of (14) in July. That’s a 100% increase! However, this is because they sell homes so fast, that they add a lot of New Home inventory at one time to try keep pace with demand. Then, they sell them just a quickly, as evidenced by the (28) Homes in Pending Status. There were no homes that Sold though. Why? It’s because none of those under Contract were completed homes.